

Key takeaways
- Average response time combines very different learner behaviors.
- Incorrect and repeat attempts can inflate apparent engagement.
- Segment quiz response time by outcome, attempt, content type, module, and cohort.
- Useful learning analytics explain behavior instead of merely summarizing activity.
The comfort of a clean average
Average time on task looks useful because it is easy to explain. A team sees that learners spend 37 seconds on a quiz question and assumes they are reading, thinking, and engaging. That conclusion does not follow. Time is an activity trace, not a learning outcome. It records duration, but not whether a learner understood the material, searched for the answer, became stuck, or retried after failing.
This is a known limitation of digital-learning data. The OECD’s analysis of assessment log data treats time on task as one process indicator among several, including time to first interaction and time since the last action. The meaning of timing data depends on the task and its context. A single LMS engagement metric removes that context precisely when an L&D team needs it most.
One number contains opposing signals
A high average quiz response time can point to several opposing realities. Learners may be applying a policy to a realistic case. They may be struggling with unclear wording. They may be opening reference material. Or they may be repeating unsuccessful attempts until they find the right answer. A low average can mean confident recall, rapid guessing, or a question that gives away its answer.
That makes average time on task learning analytics risky when used as a proxy for engagement or training effectiveness. It can reward friction and hide failure. It can also flag efficient, competent learners as disengaged simply because they do not need much time.
- Long and correct first attempts can indicate careful application.
- Long and incorrect first attempts can signal a hard, ambiguous, or poorly taught concept.
- Short and correct repeat attempts can show successful feedback or memorised answer patterns.
- Long repeat attempts can reveal persistent confusion rather than productive effort.
- Very short incorrect attempts can point to guessing, distraction, or weak task design.
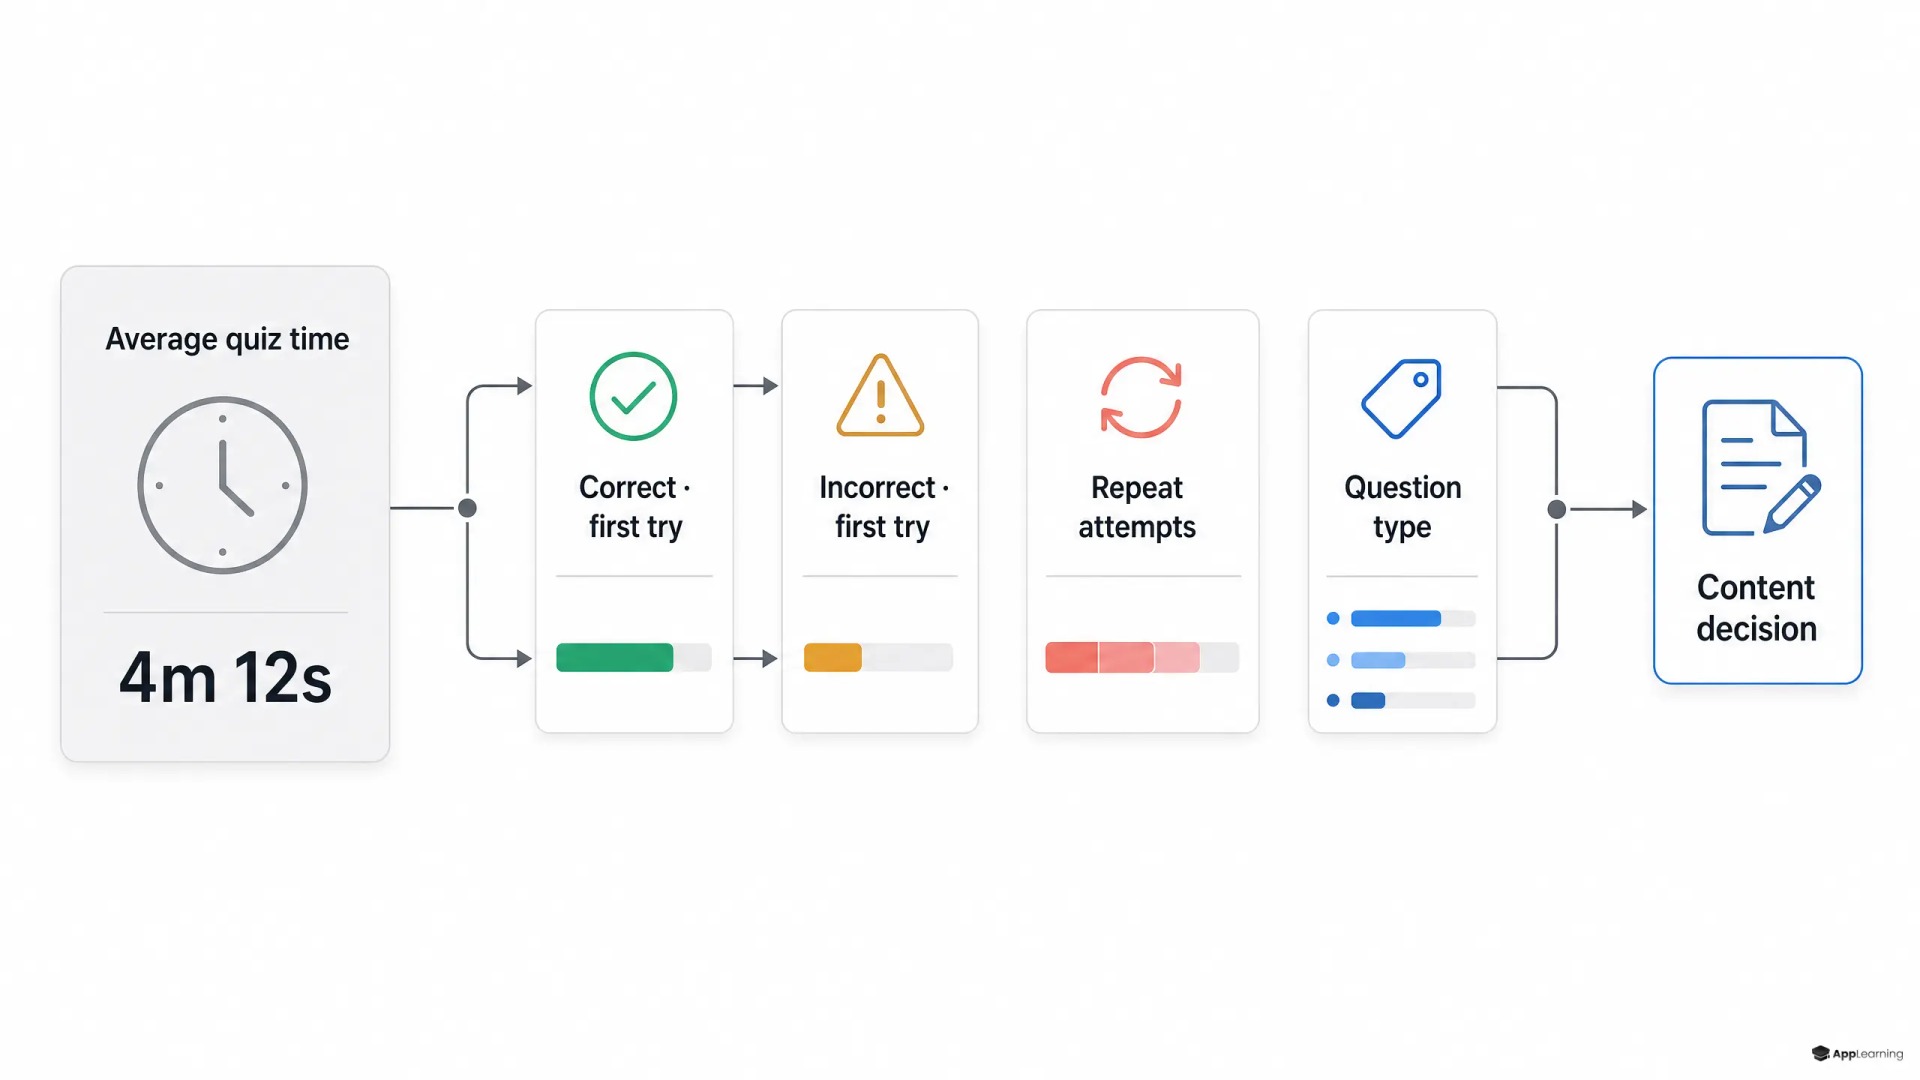
Two datasets expose the aggregation trap
Two anonymized academy datasets illustrate the problem. The first contained about 11,000 quiz events from more than 500 learners. Its average response time was roughly 37 seconds, with correct and incorrect events almost evenly split. The second contained more than 120,000 events from about 13,000 learners. Its average was roughly 61 seconds and it showed materially more incorrect attempts per learner.
The larger average in the second dataset is not evidence of deeper engagement. It may reflect harder questions, longer scenarios, less effective content, or more repeated failed attempts. The data alone cannot establish the cause. But it does establish the operational problem: an average without outcome and attempt context is not a diagnosis.
Good to know
Is average time on task ever useful?
Yes, as a high-level trend or an alert that prompts investigation. It should not be treated as proof of engagement, understanding, or training effectiveness on its own.
Which response-time segments should an LMS track first?
Start with correct versus incorrect outcomes, first versus repeat attempts, question type, module, and learner cohort. These dimensions explain most of the ambiguity hidden by one average.
How should regulated companies use learner behavior analytics?
Use aggregated, role-relevant views to improve content and support capability building. Set access rules and minimum cohort sizes so analytics remain a learning diagnostic rather than an employee-surveillance tool.
Segmentation creates the diagnostic layer
Quiz response time becomes useful when the analytics model preserves the conditions around each event. Research on assessment response processes similarly finds that timing patterns need to be interpreted alongside item characteristics and performance rather than as a standalone signal. A response-time study of simulation-based tasks examined timing together with performance, item difficulty, motivation, and test-taking behavior because each adds explanatory value.
For a learning platform, the core view should segment every response by five dimensions:
- Outcome: correct, incorrect, skipped, or partially correct.
- Attempt number: first attempt versus each repeat attempt.
- Question type: recall, scenario, calculation, policy interpretation, or simulation.
- Module: the learning topic, content version, and position in the learner journey.
- Cohort: role, business unit, onboarding group, region, or other privacy-safe grouping.
Add distributions as well as averages. Median time and upper-percentile time reduce the influence of a small number of unusually long sessions. Trend views then show whether a revised module improves first-attempt accuracy, reduces unproductive repeat attempts, or merely makes learners move faster.
Turn learning activity into actionable evidence.
DiagnoseFrom dashboard reporting to content decisions
For finance and crypto companies, this model matters because compliance completion is not enough. A module can reach 100% completion while learners still fail scenario questions about escalation rules, market-abuse controls, wallet security, or customer-data handling. If long incorrect first attempts cluster in one role cohort, the problem may be the explanation, not learner motivation. If repeat attempts fall after a content release while first-attempt accuracy rises, the new design is doing useful work.
App-Learning can operate as the analytics layer that connects quiz response time with outcome, attempts, content type, and progression. The practical aim is not to score employees by speed. It is to give learning teams a way to locate avoidable friction, isolate weak content, compare cohorts fairly, and decide where an intervention will improve capability.
Average time on task belongs on a dashboard only as an entry point. The real value starts when the system can answer what happened inside that average. That is the difference between reporting activity and understanding learner behavior.